

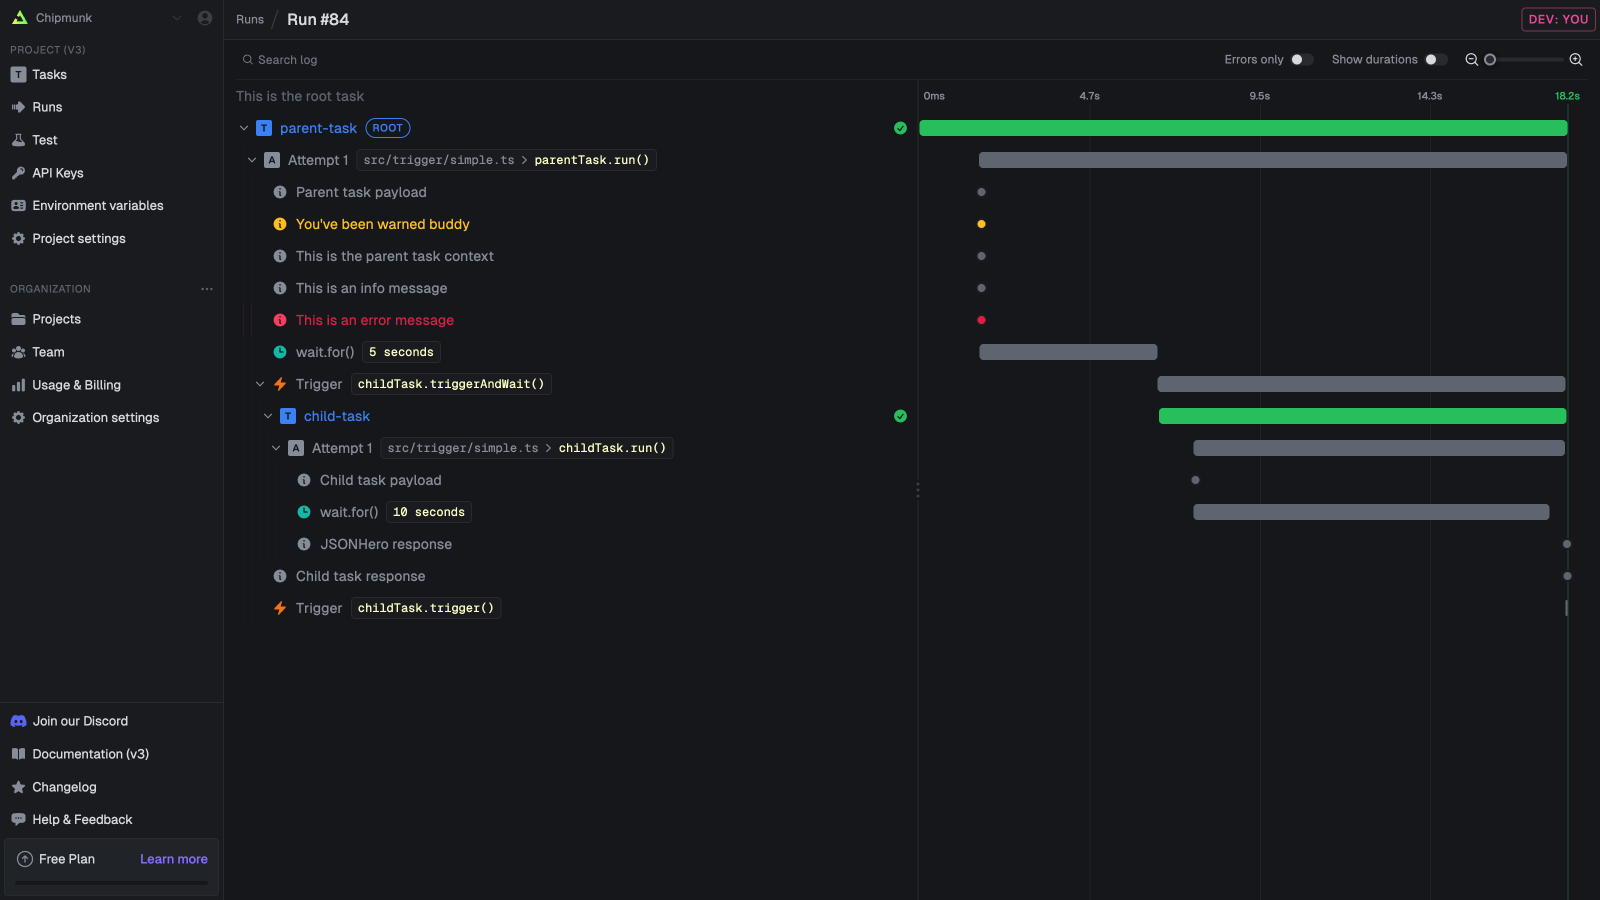
Logs
You can useconsole.log(), console.error(), etc as normal and they will be shown in your run log. This is the standard function so you can use it as you would in any other JavaScript or TypeScript code. Logs from any functions/packages will also be shown.
logger
We recommend that you use ourlogger object which creates structured logs. Structured logs will make it easier for you to search the logs to quickly find runs.
/trigger/logging.ts
Tracing and spans
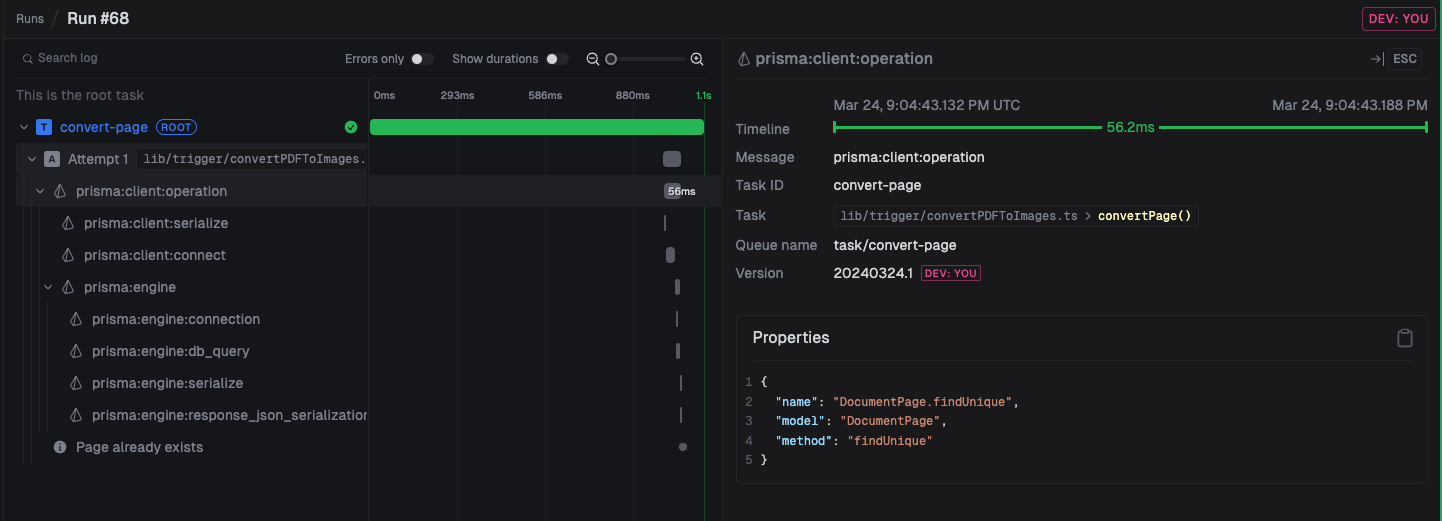
Tracing is a way to follow the flow of your code. It’s very useful for debugging and understanding how your code is working, especially with long-running or complex tasks. Trigger.dev uses OpenTelemetry tracing under the hood. With automatic tracing for many things like task triggering, task attempts, HTTP requests, and more.Adding instrumentations
Add custom traces
If you want to add custom traces to your code, you can use thelogger.trace function. It will create a new OTEL trace and you can set attributes on it.
Metrics
Trigger.dev collects system and runtime metrics automatically for deployed tasks, and provides an API for recording custom metrics using OpenTelemetry. You can view metrics in the Dashboards, query them with TRQL, and export them to external services via telemetry exporters.Custom metrics API
Importotel from @trigger.dev/sdk and use the standard OpenTelemetry Metrics API to create custom instruments.
Create instruments at module level (outside the task run function) so they are reused across runs:
/trigger/metrics.ts
Available instrument types
All instruments accept optional attributes when recording values. Attributes let you break down metrics by dimension (e.g., by item type, status, or region).
Automatic system and runtime metrics
Trigger.dev automatically collects the following metrics for deployed tasks. No configuration is needed. Requires SDK version 4.4.1 or later.In dev mode (
trigger dev), only process.* and custom metrics are available.Context attributes
All metrics (both automatic and custom) are tagged with run context so you can filter and group them:run_id— the run that produced the metrictask_identifier— the task slugattempt_number— the attempt numbermachine_name— the machine preset (e.g.,small-1x)worker_version— the deployed worker versionenvironment_type—PRODUCTION,STAGING,DEVELOPMENT, orPREVIEW
Querying metrics
Use TRQL to query metrics data. For example, to see average CPU utilization over time:metrics table schema.
Exporting metrics
You can send metrics to external observability services (Axiom, Honeycomb, Datadog, etc.) by configuring telemetry exporters in yourtrigger.config.ts.